EDITOR’S NOTE, 12/18/2021: This article is out of date. Click here for more recent data.
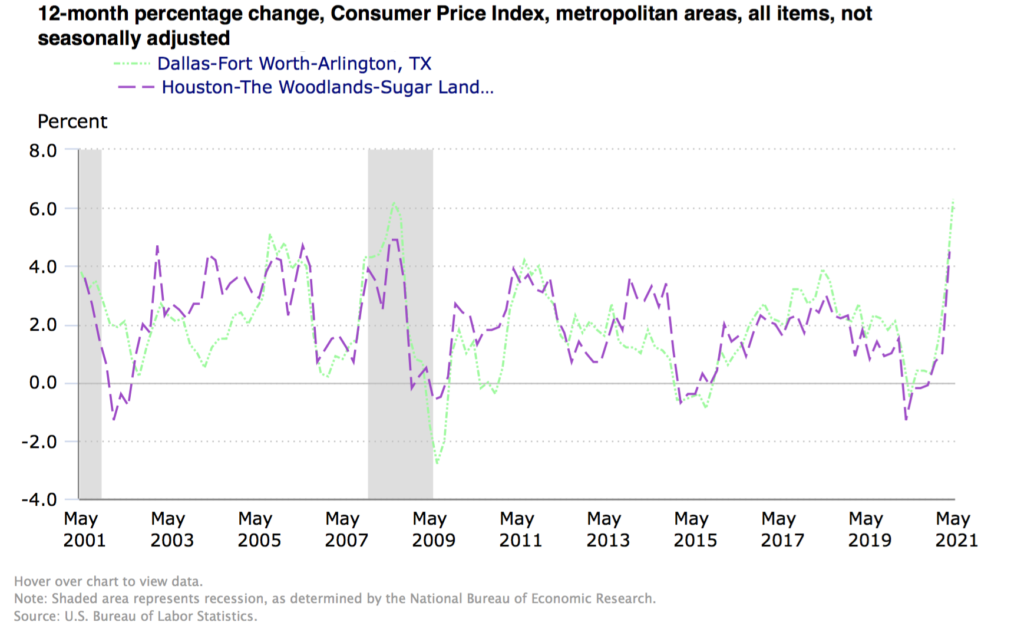
Consumer prices rose sharply in May, with North Texas recording the highest increase of all metropolitan areas tracked by the Bureau of Labor Statistics.
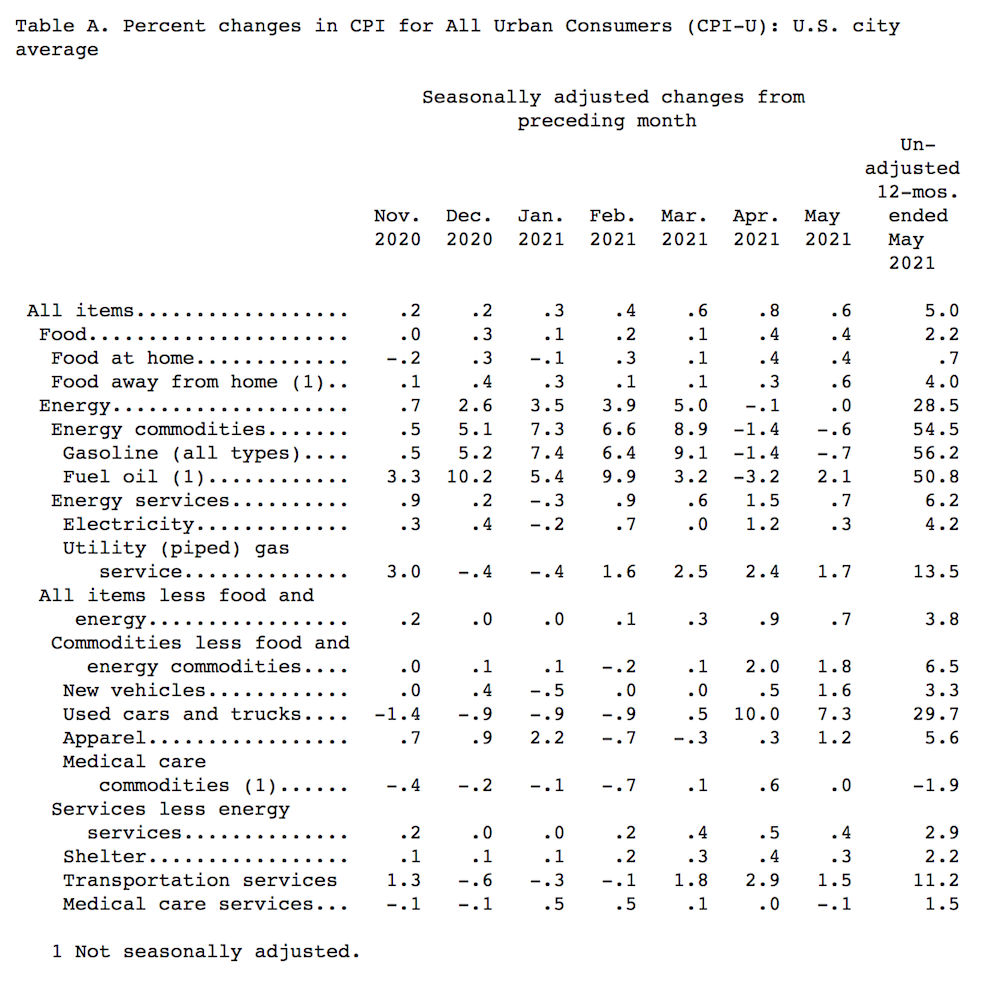
According to a data release this morning, the U.S. Consumer Price Index (CPI) rose 5% in May from a year earlier, while the CPI for the Dallas-Forth Worth-Arlington metropolitan area came in at 6.3%. (Austin isn’t among the metro areas included in the latest data release, so DFW may be the nearest proxy).
The CPI is a measure of inflation that tracks a basket of prices, including food, clothing, shelter, fuels, transportation, doctors’ and dentists’ services, drugs, and other goods and services.
Prices are rising for a variety of reasons, including transportation bottlenecks, central bank policies, increased federal spending, and rapid economic growth.
Prices of used cars and trucks rose 7.3% from a month earlier and are now up 29.7% over the course of a year. New car prices rose 1.6% on the month, boosted by a shortage of semiconductors used in automobile manufacturing.
Other components of the gauge include car rental prices, which increased 12.1% in May, and airline fares, which rose 7% in May after already increasing 10.2% the prior month.
Passenger volumes are surging, giving airlines better pricing power. In Austin, airport officials are asking travelers to arrive 2.5 hours early during peak departure times, and in Dallas the Transportation Security Administration recently asked its white collar employees to man security checkpoints.
Higher transportation and logistics costs are also filtering through into goods prices. “Our recent container prices from Asia to Dallas have been around $12,000 to $13,000,” compared to just $5,000 to $6,000 a year ago, said Molson Hart, CEO of Viahart, a toymaker.
“I’m about to pay $16,600 for a container from Qingdao to the Dallas area. I don’t know what is going to happen with this, but something is, and it won’t be good.”
Viahart, which sells on Amazon, is also facing higher charges from the e-commerce platform. “Amazon raised the fulfillment and shipping prices it charges sellers on June 1st. For us, the average increase was 7%,” said Hart, noting that this triggered his firm to raise its own prices.
The May CPI reading of 5% over the past 12 months was higher than the 4.7% consensus forecast by economists surveyed by the Wall Street Journal, and the month-on-month change of 0.6% likewise outpaced the consensus forecast of 0.5%.
The CPI inflation gauge has consistently outpaced economists’ forecasts in recent months. Last month’s monthly change of 0.8% was four times higher than expected. According to the Labor Department, the U.S. hasn’t seen this level of inflation since August 2008. So-called core CPI, which strips out the food and energy components, hasn’t risen this fast since 1992.
Regional Variances
North Texas’s inflation reading of 6.3% in May is the highest in the nation, but Central Florida saw a similar increase of 6.2% and Atlanta recorded an increase of 6%.
However, the CPI numbers for the Houston region came in only at 4.5%, below the national average. Unemployment in the Houston area was 7.1%, which is higher than the statewide average and an indicator of lagging economic activity.
The Bureau of Labor Statistics cautions that local area indexes have a smaller sample size than the national index. The local indexes are therefore “subject to substantially more sampling and other measurement error. As a result, local area indexes show greater volatility than the national index, although their long-term trends are similar.”
But regional CPI readings also show higher inflation in Texas and the South compared to the national average, and in particular the Northeast, Mid-Atlantic, and Pacific, where the lifting of pandemic restrictions on businesses and schools has lagged by six months or more.
The 12-month CPI change in the West South Central — the census division that includes Texas — came in at 5.5%, compared to the national average of 5%. Neighboring census regions of East South Central and Mountain came in at 7% and 5.5% respectively.
The Labor Department is still gathering CPI data online or over the phone due to COVID-19 restrictions. The price readings are collected each month in 75 urban areas from about 6,000 housing units and approximately 22,000 retail establishments (department stores, supermarkets, hospitals, filling stations, and other types of stores and service establishments).
May 2021 U.S. Consumer Price Index